How to get valuable virtual tour stats from Adblock users - GoThru
virtual tour stats

The next most important thing after creating and publishing your virtual tour is to integrate a system that could provide you with valuable traffic data. Because there is no use releasing a virtual tour without being able to measure its effectiveness. For this reason, Google Analytics has been widely used to measure traffic data.
But what happens with the increased number of users installing adblocking devices?
Google Analytics gets blocked
Adblocking technology is being used extensively from users aged 18 to 29 years old mainly due to the lack of smart advertising. In the present day, the average person will get exposed to more than 5,000 ads per day. And the majority of those ads will be highly intrusive and worsen the user experience.
In addition, there is an increased awareness around privacy concerns and people are getting more reluctant to allow big corporates to gather their personal data. For this reason, the number of people using adblockers is continuously growing and expanding in every generation, making it difficult for your virtual tour to measure accurate data.
Every adblocking device blocks Google Analytics leaving you with skewed data. So even if you have created a unique virtual experience for your audience, you might never get insights on the proportion of your target audience that uses adblockers. So how can you gain valuable traffic data even from your Adblock users?
GoThru 360 Tour Stats
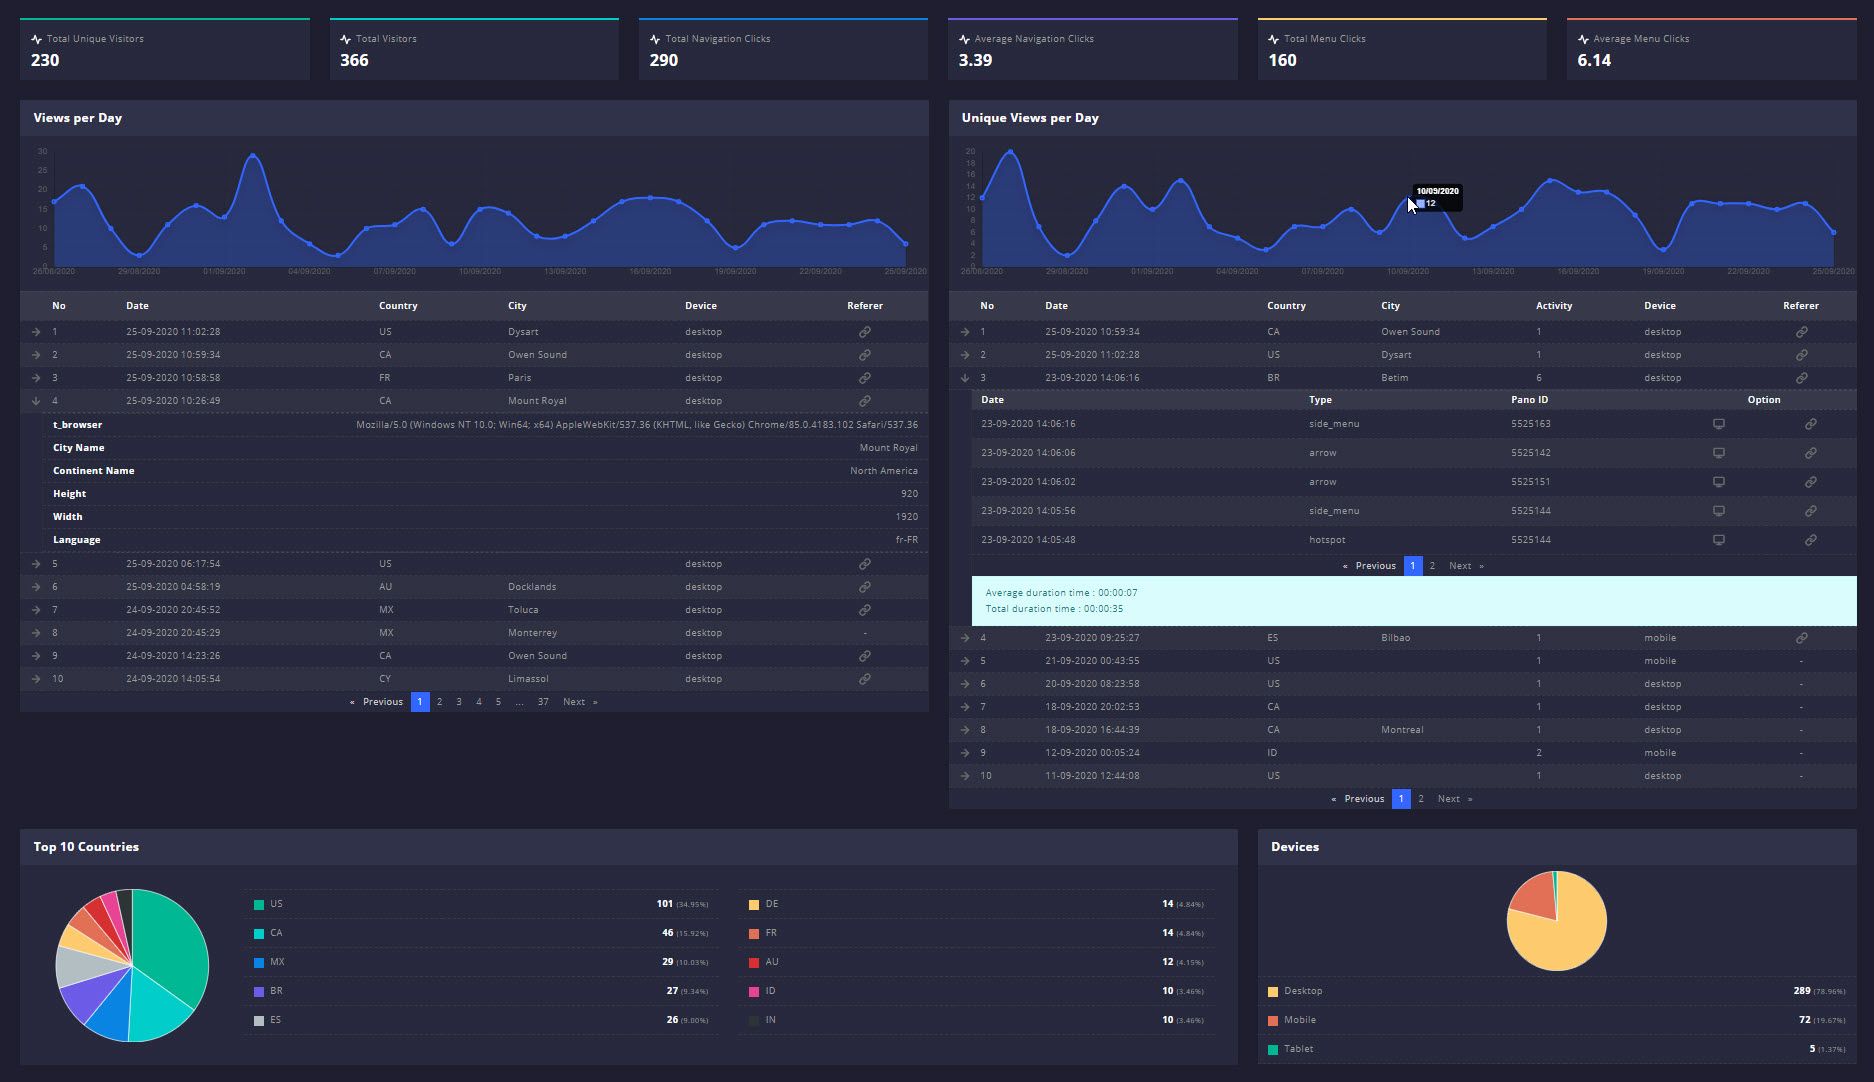
GoThru is a Toronto-based company that develops multiple tools to help 360 photographers offer better services to their clients. With the goal to provide unique virtual tour experiences, GoThru has created a Statistics Dashboard where every virtual tour creator can see a detailed report of their tour’s performance.
With extensive information on the number of visitors, unique visitors, and clicks, you are able to set up their own range and get accurate data on their traffic daily, weekly, and monthly, up to 1 year. Furthermore, stats regarding the country, city, and device, as well as the visit date are also available and thoroughly reported at the center of your analytics partner.
Last but not least, these virtual tour stats provide a smooth user experience and high personalization options. They give the user the ability of choosing their language, amongst a variety of available ones, as well as their preferred customization option since there is the possibility of light and dark theme.
Closing thoughts
Recent challenges require continuous adjustment and innovation and the virtual tour industry doe not differ. With many users preferring the installation of adblocking technology there is the need to create a new tool that can provide accurate data and facilitate growth measuring. And GoThru’s new virtual tour stats dashboard can provide exactly that.